Getting connection URL from (Flask) SQLAlchemy

While working with Flask‘s SQLAlchemy extension I ran into the case where I wanted to obtain the host I was connected to combined with the username and password.

As I didn’t want to parse the URL I provided earlier to SQLAlchemy (and I didn’t have it available at that part of the code) I looked for a method to obtain it from SQLAlchemy.

It turns out this is not (or poorly) documented, but the Engine object has a attribute called url.

>>> db.engine.url
mysql+mysqlconnector://sqlmanager:***@localhost/sqlmanager?charset=utf8
>>>

This is actually a sqlalchemy.engine.url.URL object which contains attributes with the connection information:

>>> url = db.engine.url
>>> url.host
'localhost'
>>> url.username
'sqlmanager'
>>> url.password
'supersecretpassword'
>>> url.database
'sqlmanager'
>>> 

This was the information I needed and allowed me to use this information elsewhere.

4 years of Tesla Model S ownership

4 years

Last year I wrote a blogpost about 3 years of Model S ownership. Well, it’s a year later, so it’s time to write a post about 4 years of ownership 🙂

Do I still like my Model S? Best car I’ve ever owned!

The numbers

Some numbers about last year:

  • Last year my Model S had driven 141.466km, and another year later the counter is at 187.058km. A total of 45.592km in one year.
  • My average energy consumption still hovers somewhere around 200Wh/km.
  • A full charge (100%) yields 380km and a 90% charge 341km.

Roadtrips

The Model S is still my only car and I still take roadtrips with it. This year I took a few roadtrips:

  • 1.400km roadtrip to the UK and back (SuperChargers at the channel tunnel, yay!)
  • 3.500km to Milan/Rome for a summer vacation.
  • 2.000km roadtrip to Munich for Oktoberfest.

Pictures

A few pictures how my Model S still looks like after 4 years. Personally I can’t find any real signs of wear on the exterior nor interior.

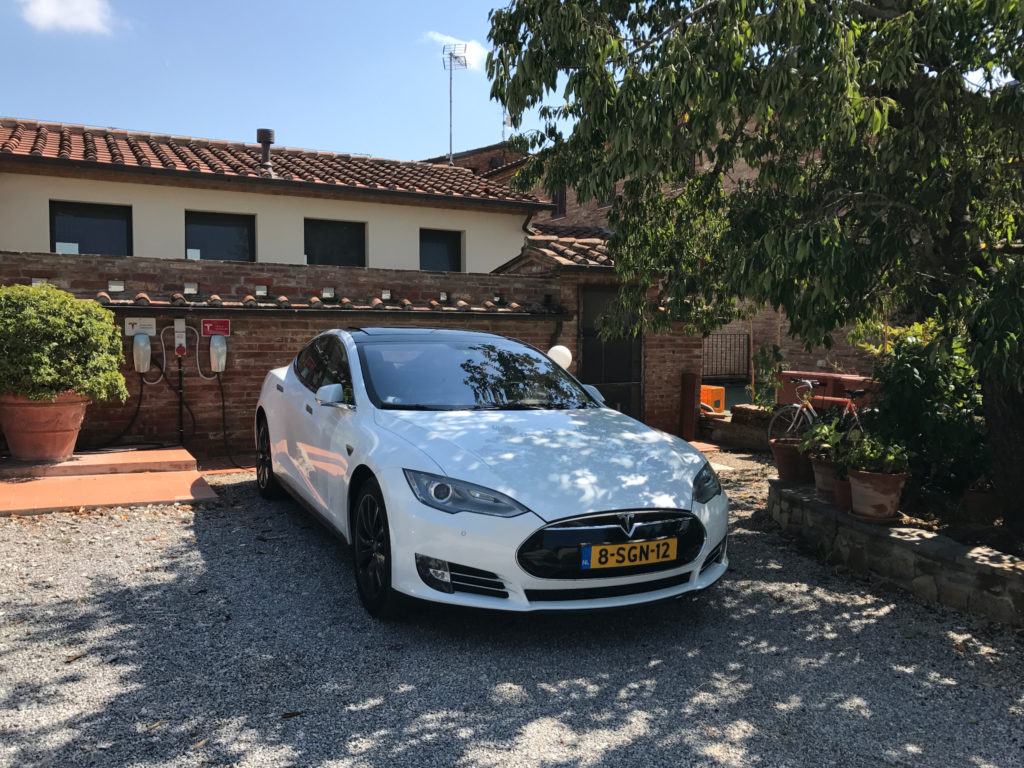
Using a Destination Charger in Tuscany, Italy

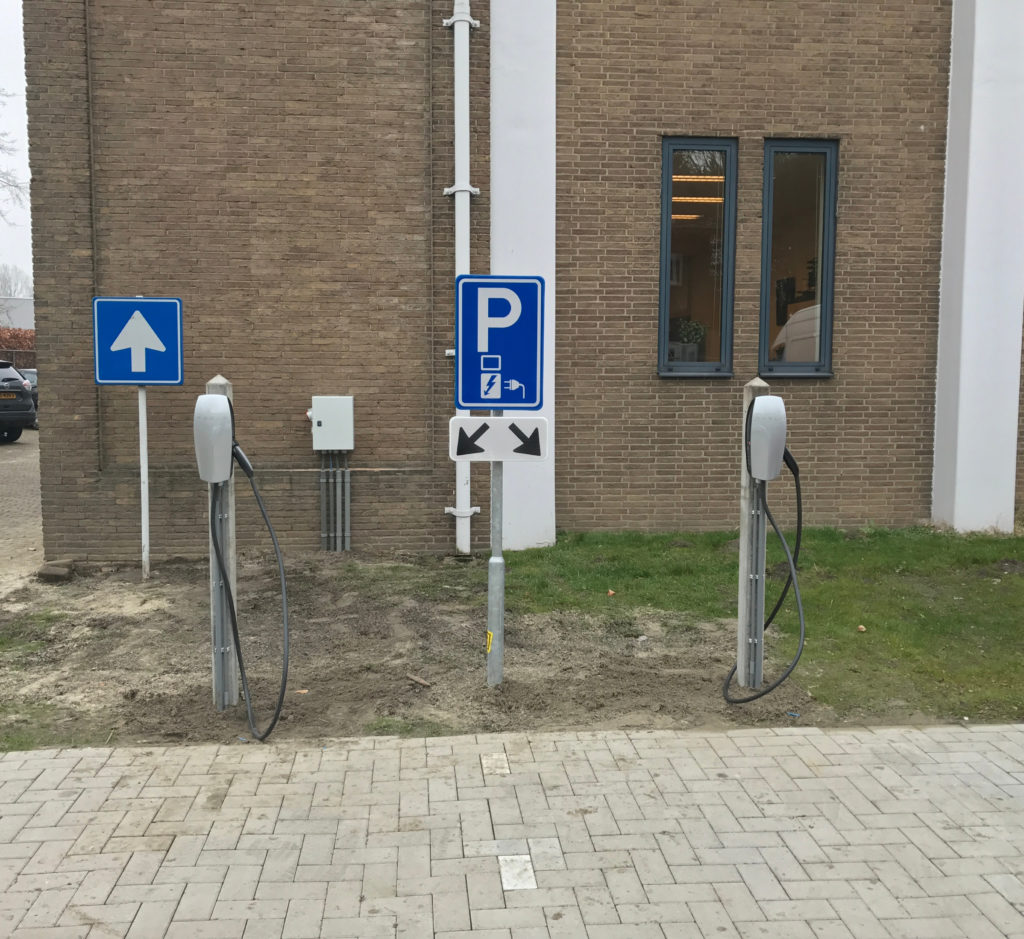
Tesla charging stations (22kW) at our new office

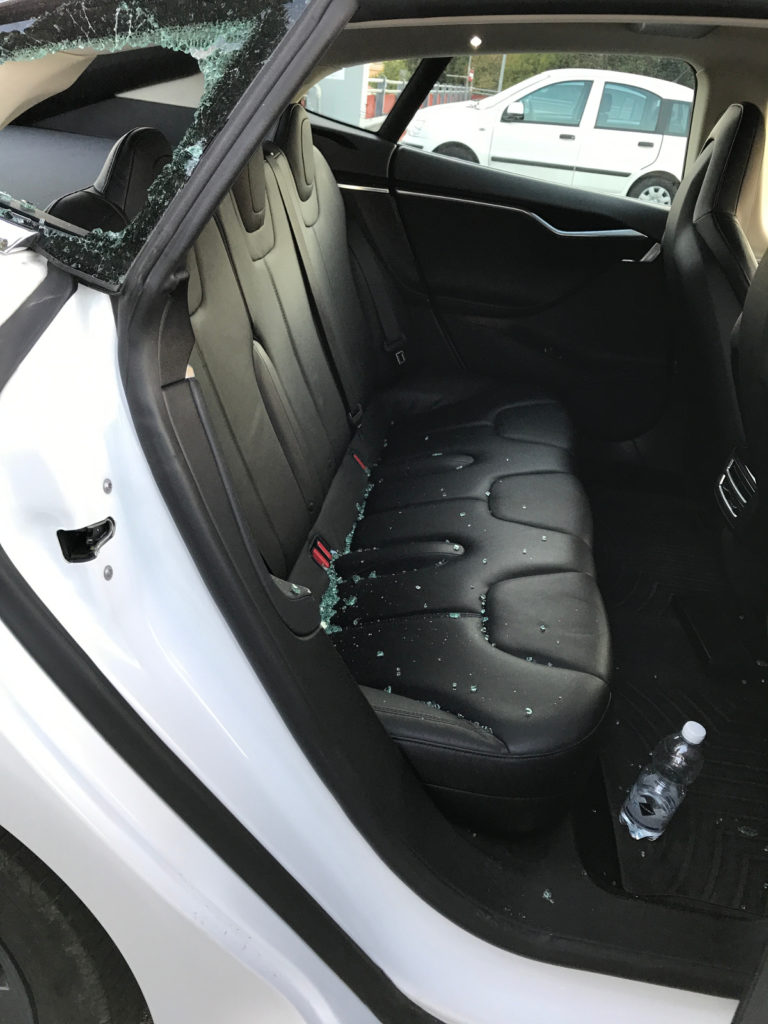
Break-in in Rome

While parked in Rome people broke in to the car and stole clothing. And punctured the rear wheels…

Accident in Milan

On the way back from Rome a small truck changed lane and hit us. Nobody got hurt, just some damage to the car.

Conclusion

After 4 years my Model S is still doing just fine! No wear and tear, no severe battery degradation or major failures. The car just works!

I’ll probably keep this Model S until it turns 5 next year and buy a new one. Will I buy a Tesla again? Yes, no doubt!

Using the new dashboard in ceph-mgr

The upcoming Ceph Luminous (12.2.0) release features the new ceph-mgr daemon which has a few default plugins. One of these plugins is a dashboard to give you a graphical overview of your cluster.

Enabling Module

To enable the dashboard you have to enable the module in your /etc/ceph/ceph.conf on all machines running the ceph-mgr daemon. These are usually your Monitors.

Add this to the configuration:

[mgr]
mgr_modules = dashboard

Don’t restart your ceph-mgr daemon yet. More configuration changes have to be made first.

Setting server address and port

A server address and optionally a port have to be configured as a config-key.

By setting the value to :: the dashboard will be available on all IPv4 and IPv6 addresses on port 7000 (default):

ceph config-key put mgr/dashboard/server_addr ::

Restart daemons

Now restart all ceph-mgr daemons on your hosts:

systemctl restart ceph-mgr@

Accessing the dashboard

The default port is 7000, so now go to the IP-Address of the active ceph-mgr and open the see the dashboard.

You can find the active ceph-mgr in the ceph status:

root@alpha:~# ceph -s
  cluster:
    id:     30d838cd-955f-42e5-bddb-5609e1c880f8
    health: HEALTH_OK
 
  services:
    mon: 3 daemons, quorum alpha,bravo,charlie
    mgr: charlie(active), standbys: alpha, bravo
    osd: 3 osds: 3 up, 3 in
 
  data:
    pools:   1 pools, 64 pgs
    objects: 0 objects, 0 bytes
    usage:   3173 MB used, 27243 MB / 30416 MB avail
    pgs:     64 active+clean
 
root@alpha:~#

In this case charlie is the active mgr which in my case has IPv6 Address 2001:db8::102.

Point your browser to: http://[2001:db8::102]:7000 and you will see the dashboard.