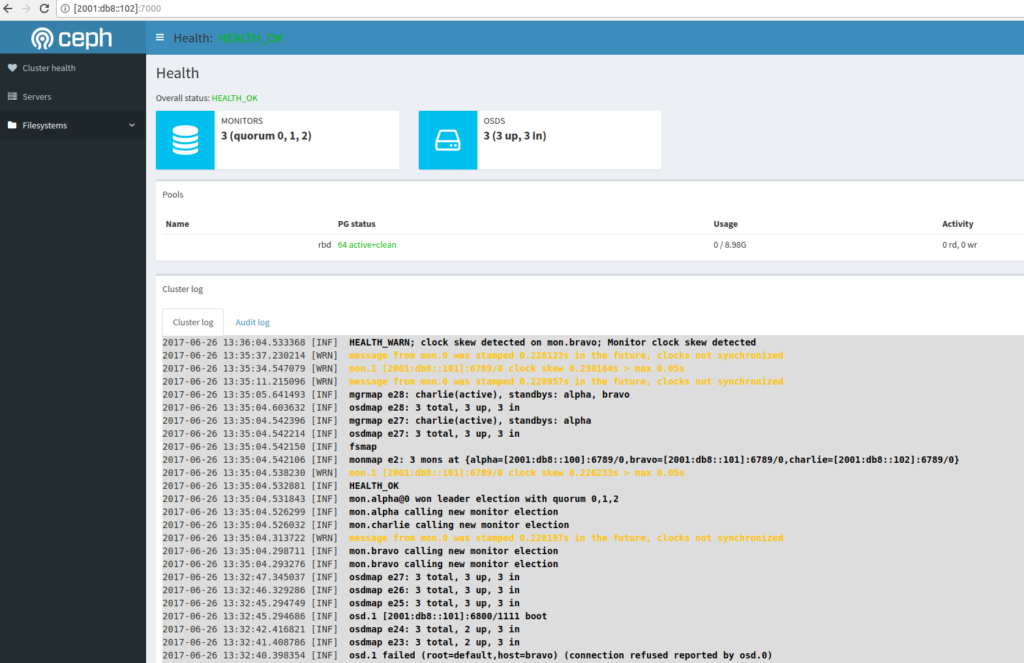
The upcoming Ceph Luminous (12.2.0) release features the new ceph-mgr daemon which has a few default plugins. One of these plugins is a dashboard to give you a graphical overview of your cluster.
Enabling Module
To enable the dashboard you have to enable the module in your /etc/ceph/ceph.conf on all machines running the ceph-mgr daemon. These are usually your Monitors.
Add this to the configuration:
[mgr]
mgr_modules = dashboard
Don’t restart your ceph-mgr daemon yet. More configuration changes have to be made first.
Setting server address and port
A server address and optionally a port have to be configured as a config-key.
By setting the value to :: the dashboard will be available on all IPv4 and IPv6 addresses on port 7000 (default):
ceph config-key put mgr/dashboard/server_addr ::
Restart daemons
Now restart all ceph-mgr daemons on your hosts:
systemctl restart ceph-mgr@
Accessing the dashboard
The default port is 7000, so now go to the IP-Address of the active ceph-mgr and open the see the dashboard.
You can find the active ceph-mgr in the ceph status:
root@alpha:~# ceph -s
  cluster:
    id:     30d838cd-955f-42e5-bddb-5609e1c880f8
    health: HEALTH_OK

  services:
    mon: 3 daemons, quorum alpha,bravo,charlie
    mgr: charlie(active), standbys: alpha, bravo
    osd: 3 osds: 3 up, 3 in

  data:
    pools:   1 pools, 64 pgs
    objects: 0 objects, 0 bytes
    usage:   3173 MB used, 27243 MB / 30416 MB avail
    pgs:     64 active+clean

root@alpha:~#
In this case charlie is the active mgr which in my case has IPv6 Address 2001:db8::102.
Point your browser to: http://[2001:db8::102]:7000 and you will see the dashboard.
