HAProxy in front of Ceph Manager dashboard

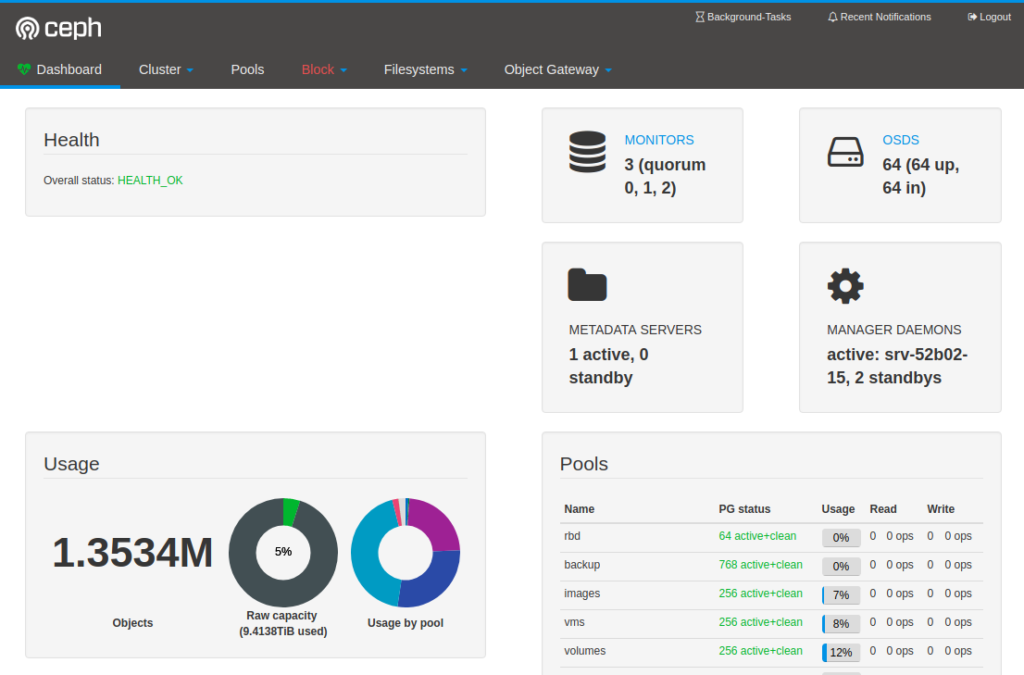
The Ceph Mgr dashboard plugin allows for an easy dashboard which can show you how your Ceph cluster is performing.

In certain situations you can’t contact the Mgr daemons directly and you have to place a Proxy server between your computer and the Mgr daemons.

This can be done easily with HAProxy and the following configuration which assumes that:

  • SSL has been disabled in the Dashboard plugin
  • Dashboard plugin listens in port 8080
  • Mgr is running on the hosts mon01, mon02 and mon03
global
  log         127.0.0.1 local1
  log         127.0.0.1 local2 notice

  chroot      /var/lib/haproxy
  pidfile     /var/run/haproxy.pid
  maxconn     4000
  user        haproxy
  group       haproxy
  daemon

  stats socket /var/lib/haproxy/stats

defaults
  log                     global
  mode                    http
  retries                 3
  timeout http-request    10s
  timeout queue           1m
  timeout connect         10s
  timeout client          1m
  timeout server          1m
  timeout http-keep-alive 10s
  timeout check           10s
  maxconn                 3000
  option                  httplog
  no option               httpclose
  no option               http-server-close
  no option               forceclose

  stats enable
  stats hide-version
  stats refresh 30s
  stats show-node
  stats uri /haproxy?stats
  stats auth admin:haproxy

frontend https
  bind *:80
  default_backend ceph-dashboard

backend ceph-dashboard
  balance roundrobin
  option httpchk GET /
  http-check expect status 200
  server mon01 mon01:8080 check
  server mon02 mon02:8080 check
  server mon03 mon03:8080 check

You can now point your browser to the URL/IP of your HAProxy and use your Ceph dashboard.

In case a Mgr machine fails the health checks of HAProxy will make sure it fails over to on of the other Mgr daemons.

Placement Groups with Ceph Luminous stay in activating state

Placement Groups stuck in activating

When migrating from FileStore with BlueStore with Ceph Luminuous you might run into the problem that certain Placement Groups stay stuck in the activating state.

44    activating+undersized+degraded+remapped

PG Overdose

This is a side-effect of the new PG overdose protection in Ceph Luminous.

Too many PGs on your OSDs can cause serious performance or availability problems.

You can see the amount of Placement Groups per OSD using this command:

$ ceph osd df

Increase Max PG per OSD

The default value is a maximum of 200 PGs per OSD and you should stay below that! However, if you are hit by PGs in the activating state you can set this configuration value:

[global]
mon_max_pg_per_osd = 500

Then restart the OSDs and MONs which are serving the affected by this.

Usually you shouldn’t run into this, but if this hits you in the middle of a migration or upgrade this might save you.

Quick overview of Ceph version running on OSDs

When checking a Ceph cluster it’s useful to know which versions you OSDs in the cluster are running.

There is a very simple on-line command to do this:

ceph osd metadata|jq '.[].ceph_version'|sort|uniq -c

Running this on a cluster which is currently being upgraded to Jewel to Luminous it shows:

     10 "ceph version 10.2.6 (656b5b63ed7c43bd014bcafd81b001959d5f089f)"
   1670 "ceph version 10.2.7 (50e863e0f4bc8f4b9e31156de690d765af245185)"
    426 "ceph version 10.2.9 (2ee413f77150c0f375ff6f10edd6c8f9c7d060d0)"
     66 "ceph version 12.2.1 (3e7492b9ada8bdc9a5cd0feafd42fbca27f9c38e) luminous (stable)"

So 66 OSDs are running Luminous and 2106 OSDs are running Jewel.

Starting with Luminous there is also this command:

ceph features

This shows us all daemon and client versions in the cluster:

{
    "mon": {
        "group": {
            "features": "0x1ffddff8eea4fffb",
            "release": "luminous",
            "num": 5
        }
    },
    "osd": {
        "group": {
            "features": "0x7fddff8ee84bffb",
            "release": "jewel",
            "num": 426
        },
        "group": {
            "features": "0x1ffddff8eea4fffb",
            "release": "luminous",
            "num": 66
        }
    },
    "client": {
        "group": {
            "features": "0x7fddff8ee84bffb",
            "release": "jewel",
            "num": 357
        },
        "group": {
            "features": "0x1ffddff8eea4fffb",
            "release": "luminous",
            "num": 7
        }
    }
}